1. Input your data and generate targets
Once you’ve input your data you can use Alps to generate Minimum Expected Grades (MEGs). Establishing MEGs in the autumn at the start of a student’s programme is an essential part of the Alps culture. Setting them at the equivalent of the top 25% is aspirational but achievable and is proven to drive up outcomes for students.

2. We crunch your data and provide your analysis
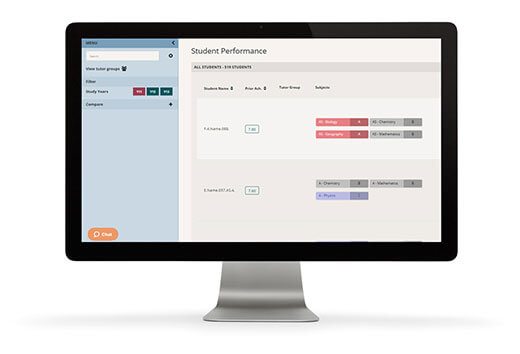
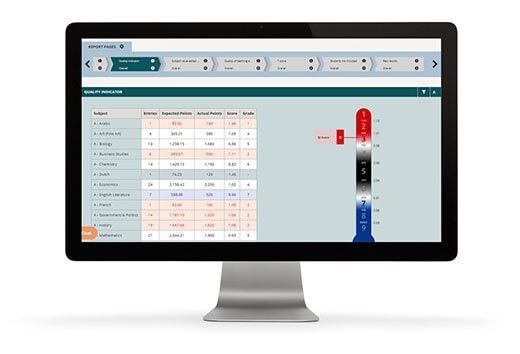
On inputting your data your analysis is available immediately in Alps Connect Reports & Downloads. You can either download your selected report as PDF, or if you’ve purchased Alps Connect Interactive, you can start using our online analysis tools straight away. We’ve been honing our methodology for over 20 years, so it’s tried and tested. You can measure value-added progress for individual students, departments or the whole school or college, using robust benchmarks based on the full national dataset.
3. The well-known Alps analysis tools
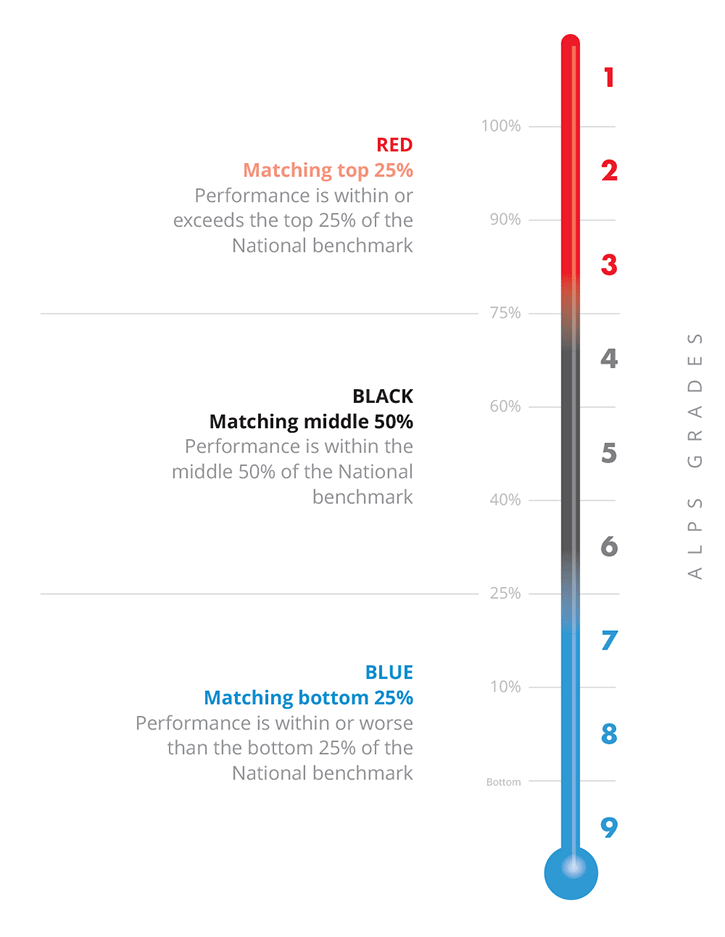
To help make interpreting analysis simple we’ve developed distinctive, easy to use tools. Together these provide stakeholders with a common language for discussing your students’ performance.
Alps Grading System:
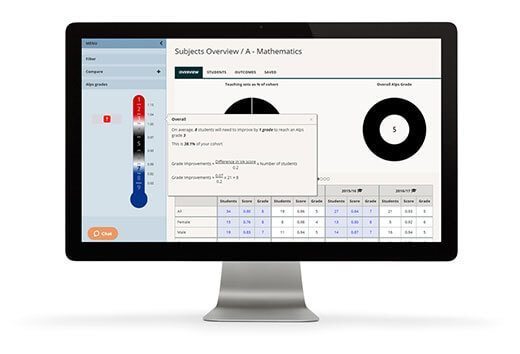
Outcomes are graded from 1-9 to show performance against national benchmarks.
A simple 3-colour Coding System:
RED, BLACK and BLUE show performance against national benchmarks by colour, making the analysis easy to interpret for all.
Alps Thermometers:
These make the grading and colour coding systems instantly understandable. Our thermometers let teachers know at a glance how their class is performing against national benchmarks.
5. Ask the right questions at the right time
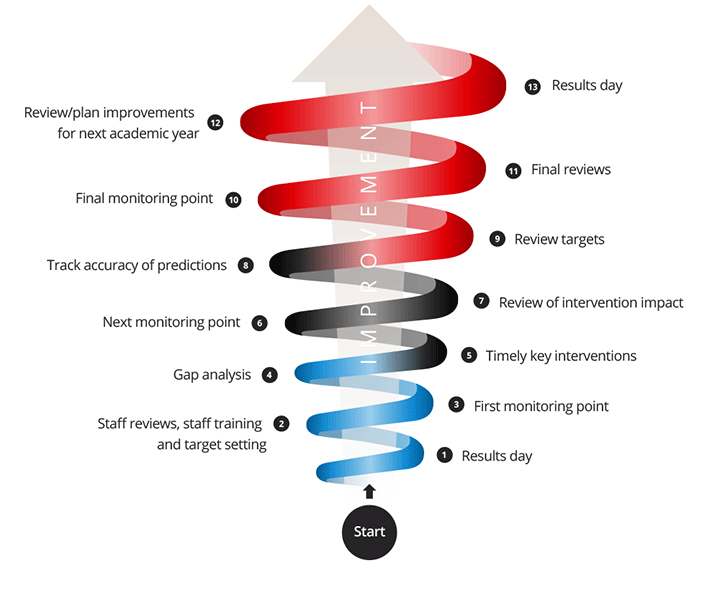
The analysis we provide is simple but incredibly incisive. From this you can start to ask the right questions at the right times, identifying strengths and weaknesses and developing purposeful agendas for improvement.
6. Make smart interventions
Analysis is only the starting point. Once you have asked the questions and fully understand the areas to celebrate or the areas of concern, you can quickly and easily identify at risk students, subjects or teaching sets and make vital interventions to make a decisive difference to students and staff. Conversely, you can identify the areas of strong performance to celebrate and encourage the sharing of best practice with lower performing groups, vital for continuous improvement.
7. Keep improving
Outstanding schools and colleges do not rest on their laurels and are constantly striving to improve. Sharing good practice, eliminating low performance, learning from previous years, embedding the systems and refreshing expectations can all help in the pursuit of excellence. The 4-year analysis trend also helps you plan strategically, so you can achieve long-term improvements in performance.
