Using Alps Connect effectively to evaluate the impact of attendance strategies.
1. The challenge of improving attendance rates
Since the pandemic, one of the most significant challenges facing the educational sector has been the continual high rates of student absenteeism. In 2022-2023, 22.3% of compulsory school age students in England were classed by the DfE (Department for Education) as being persistently absent from school. Despite a major focus on attendance both at a local and national level this figure remains above 20% in 2023-2024. In 2022-2023, the rate of persistent absenteeism was significantly higher for disadvantaged students (37.9%) which was a 0.7% increase on the previous academic year. The attendance gap between disadvantaged and non-disadvantaged students in England continues to widen and in 2022-2023 rose to 21.2% (Department for Education pupil absence statistics for 2022-2023, and 2023-2024).
As a response to this, in January 2024, the DfE announced the introduction of a further eighteen attendance hubs (bringing the total to thirty-two). This initiative involves lead schools who have been identified as having effective practices sharing their strategies and resources to support others. In addition to this, a further £15 million has been allocated over the next three years for the expansion of the attendance mentoring scheme. The scheme which started as a Barnardo’s run pilot in 2022, is aimed at students who have missed more than half of their lessons. Through working with both students and their families, mentors aim to gain a better understanding of the barriers that are preventing good attendance and through targeted support hope to resolve these.
Improving attendance in Welsh schools is also a major focus. In January 2024, Estyn published a thematic report “Improving attendance in secondary schools” which highlighted their concern that attendance rates have declined since the pandemic and that the attendance rates of students eligible for free school meals (eFSM) is significantly lower than those of non-eFSM students. The report considers a range of barriers that schools face when tackling poor attendance, including how parents view the importance of good attendance, increasing costs associated with school transport, and the lack of dedicated funding to improve attendance.
Although there is still much debate over the reasons behind such elevated levels of student absence in both England and Wales, a large body of research does seem to agree that school absenteeism is detrimental to learning, academic achievement, and educational outcomes. For instance, several studies have shown that missing school, even for a limited number of days and regardless of the reasons, negatively affects students’ academic achievement (Gershenson, McBean and Tran, 2018 Kirksey, 2019, Keppens, 2023).
2. The importance of using data effectively when tackling student absenteeism
As part of their recent thematic study, Estyn found that schools which have been the most effective at reducing absenteeism, have a strong culture of high expectations regarding attendance, focus on high quality teaching, and effectively evaluate the impact of their work. They recommend that school leaders should strengthen planning to strategically improve attendance, including making effective use of data to identify trends and when planning long term approaches. The importance of using data effectively when devising strategic approaches to tackling poor attendance has also been highlighted by the DfE as part of their recent guidance document for schools, academy trusts, governing bodies, and local authorities, ‘Working together to improve school attendance’.
Within Alps Connect, school leaders can analyse and evaluate outcomes at a strategic, subject and student level. It is also easy to track the academic progress of key student groups, i.e. by gender, disadvantaged/non-disadvantaged, EAL, SEND status etc. With attendance being such a key focus, increasingly schools and colleges I am working with are choosing to set up custom groups within Connect to track, monitor and evaluate the value-added outcomes of different attendance cohorts. After identifying a group of students through Connect where poor attendance is significantly impacting on their value-added progress, senior leaders, middle leaders, and subject teachers can then target this group through interventions and attendance strategies. Through analysis of subsequent monitoring and examination gradepoints, providers can then effectively evaluate the impact of both subject and whole-school strategies that have been put in place to improve attendance rates and to address gaps in learning caused by poor attendance.
3. Setting up an attendance custom comparison group within Alps Connect to evaluate outcomes and strategies
Many providers may already use custom columns to support their tracking of students who may be new to their sixth form, or to evaluate outcomes by feeder school. To set up a custom group which focusses on attendance, all users need to do is to add an attendance column in their student data upload.
Fig. 1
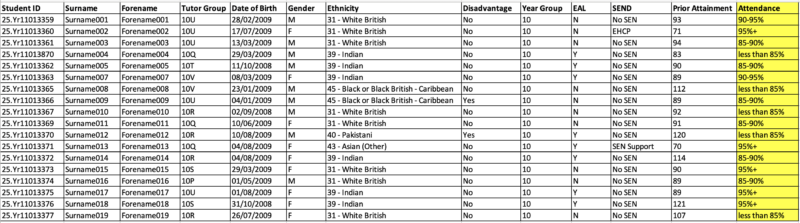
When adding a custom column for attendance, it is important to divide the students up into different attendance groups. For example, in my Alps Demonstration School, I have grouped the students into four categories, 95%+, 90-95%, 85-90% and less than 85% attendance (see Fig.1), however these groupings can be defined by the school. If data managers need any support to upload an attendance custom column, we have articles within our Support Hub which cover this, and our Alps Customer Success Team are also on hand via our live chat facility to offer help and guidance.
After adding and uploading your custom column, you will be prompted to republish any gradepoints related to this data, so that these changes can take effect. You will then be able to analyse and evaluate outcomes at a strategic, subject and student level for each attendance group. The screenshots that follow illustrate the variety of analysis that users can obtain from setting up a custom column for attendance. I have chosen to do this for my year 10 cohort in February for my Alps demonstration school.
Using the Strategic Analysis area of Alps Connect, I can gain a better understanding of how poor attendance is impacting my cohort’s value-added progress. To do this I simply apply the ‘attendance comparison’ from the Apply Comparisons drop-down menu whilst visiting the Overview page – see Fig.2.
Fig. 2
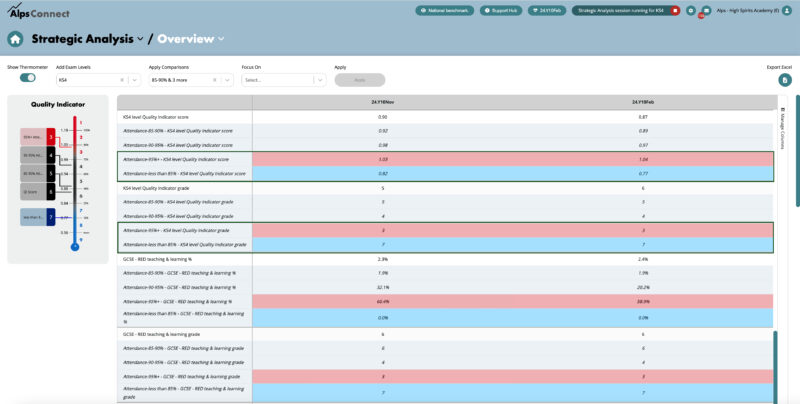
For this latest gradepoint, teachers have been asked to make grade predictions for students based on the evidence they have seen so far. Overall, my cohort is predicted to achieve outcomes matching the lower 40% of providers in the national dataset (Alps Quality Indicator grade = 6), however from this exercise I can clearly see the impact that poor attendance is having on my cohort’s value-added outcomes. Students in my school who have an overall attendance of 95%+ are predicted to achieve outcomes in the top 25% of the dataset (Alps QI grade = 3) with students with an overall attendance figure of less than 85% being predicted to have value-added outcomes that match the lower 25% of providers within the dataset (Alps QI grade = 7). The difference in QI score of 0.27 equates to more than a grade’s difference in progress per student.
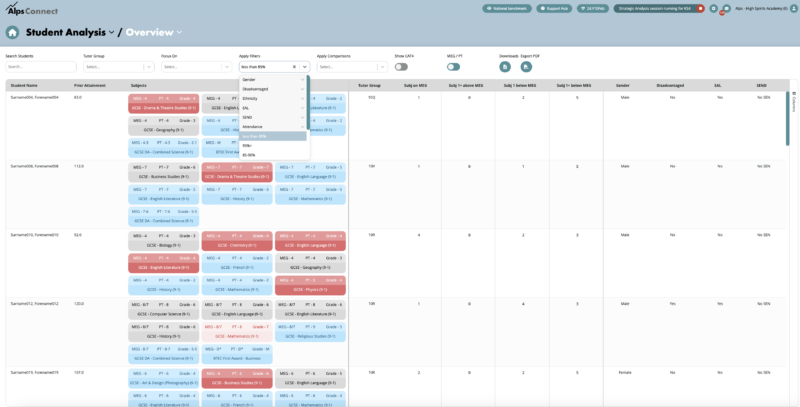
Within both the Subject Analysis (Fig.3) and Student Analysis Overview (Fig.4) areas of Connect, users are also able to evaluate the impact of poor attendance on value-added progress using both our filters and comparison tools.
Fig.3 – Subject Analysis
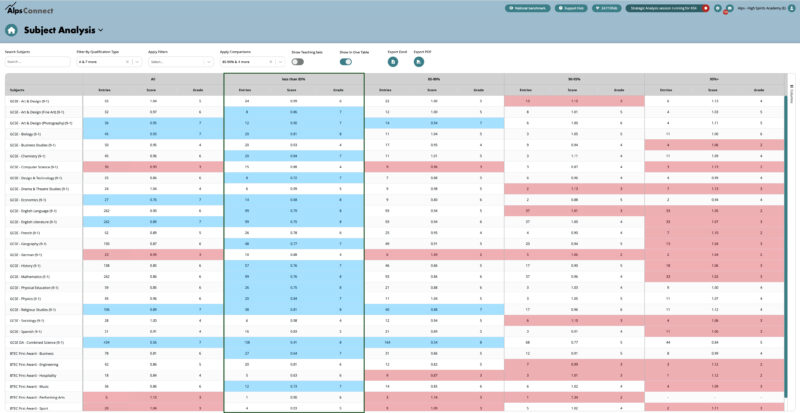
Fig. 4 – Student Analysis
When setting up a custom column for attendance, it is important to realise that your attendance groupings reflect the situation at a particular point in the academic year. Some providers may choose to regularly update these groupings so they can monitor the change in numbers of students within each attendance category. This provides one way of evaluating the effectiveness of attendance strategies as well as the impact these are having on overall value-added outcomes. However, an alternative approach could be to set up a custom column at a time in the academic year when you feel attendance patterns in your learners are beginning to become well-established and keep these same groupings throughout the academic year.
Once attendance groupings have been set up within Connect, you can model the impact of any interventions and identify ‘winnable’ students who have the potential to improve using the ‘How Do I’ (Fig.5) and ‘What If’ tools (Fig.7) within the Subject Analysis area. For groups of students with the highest rates of absenteeism, alongside implementing strategies to improve their attendance, some schools may decide just to focus their interventions on core subjects, due to substantial gaps in learning caused by missed sessions (Fig.6). Grouping students into different attendance cohorts will also help subject leaders and teacher to identify students who despite good attendance, are still not making expected progress. This could be down to factors such as behaviour, a lack of engagement in lessons or simply a lack of understanding in key topics that can be addressed in future teaching.
Fig.5 – How do I
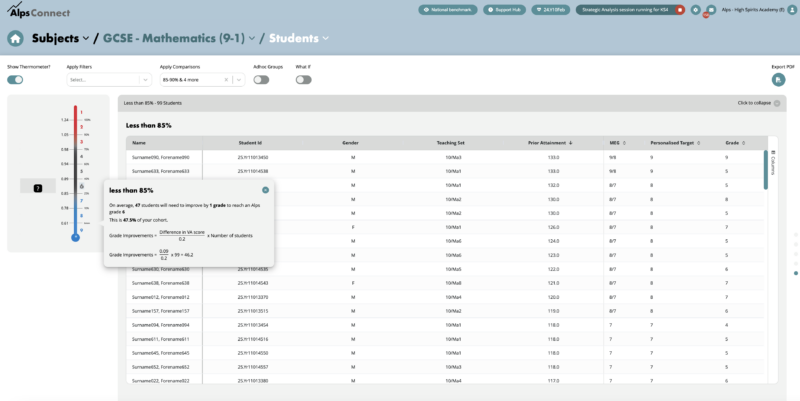
Fig.6 – Subject comparison
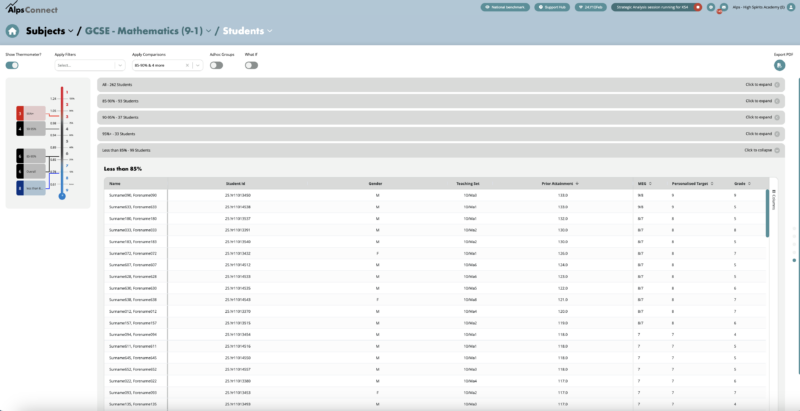
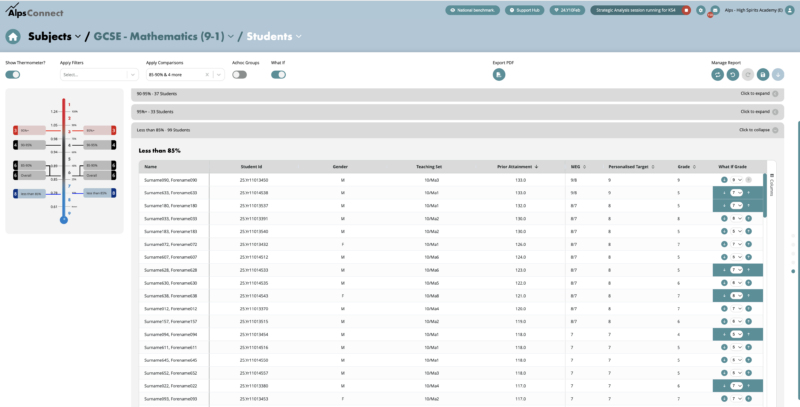
Fig.7 – What If
As I have discussed in this briefing paper, improving attendance is a key focus in both England and Wales. Providers will already be using a variety of interventions and strategies to tackle the issue and
with the introduction of initiatives such as attendance hubs, mentoring programmes, and the publication of further guidance documents there is now an even greater need for robust evaluation of their impact. It is therefore vital that senior leaders determine the most effective strategies when it comes to improving attendance and addressing learning gaps. These may vary depending on the nature of each school’s cohorts and context and therefore the ability through Alps Connect to evaluate impact in terms of value-added progress is an incredibly powerful analytical tool.
I hope that you have found the information in this briefing paper useful and please do not hesitate to contact us directly if you would like further support to get started with using attendance custom comparison groups in Alps Connect.

About the author, John Roe: John has worked in education for 22 years as a science teacher, head of department and pastoral lead. John is passionate about creating an aspirational culture and supporting students to achieve their full potential. Prior to joining Alps, John was Director of Radyr Sixth Form in Cardiff for 10 years, where he lead the transformation of the sixth form with student outcomes consistently matching the performance of the top 2% nationally.